1. Introduction
In planning for our next-gen Cluster HPC3, we need to understand how our current ones are being used, and especially which resources are over- and under-used. Some background:
UCI has 2 large clusters: HPC, which is used by most researchers, and GreenPlanet, used by only the Physical Sciences. In this doc, I’ll describe only HPC since I don’t have admin access to GreenPlanet.
2. HPC user profiles
HPC has almost 3000 users in the passwd file. Of those, about 30-100 are active simultaneously on 2 login nodes and about 200 users log in to HPC every month, with the majority being fairly heavy users.
See this page that show the running CPU usage totals by School.
See this page for usage by research group.
3. Current CPU and RAM utilization.
Imam Toufique installed and is supervising the HPC xdmod monitor (only inside of UCI), which shows by-Q usage of HPC graphically, similar to the tabular data noted below.
Also thanks to Imam, HPC’s Ganglia installation has recorded CPU utilization for the past several months. You can see (if you’re inside UCI) that the CPU utilization has rarely exceeded 55% over the life of ganglia and that the cluster is vastly over-provisioned with expensive RAM that is rarely used. If you are outside UCI, here is the summary view:
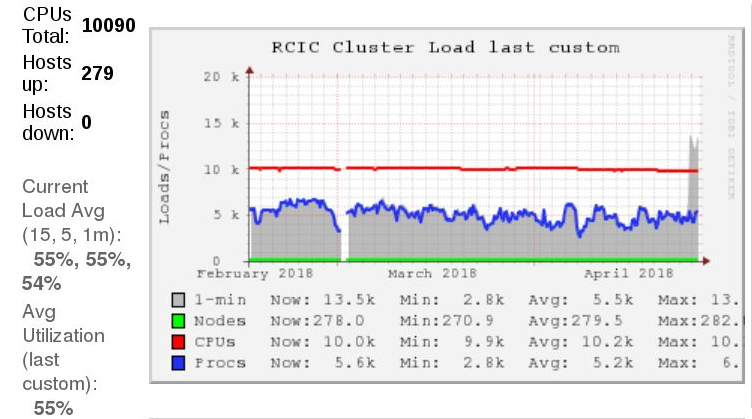 The above graph shows that of the ~10K CPU cores on HPC, we only use about 55%.
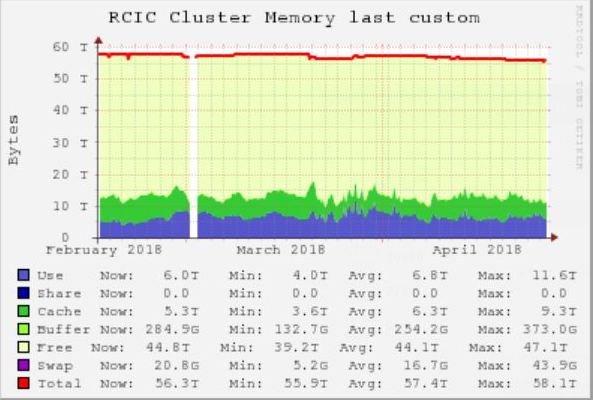
And even more unbalanced, we only use about 17TB of the aggregate 55TB of RAM on the system, altho some jobs do hit the upper reaches of the the per-machine RAM.
In contrast, the following image shows how highly utilized the Free Qs can be.
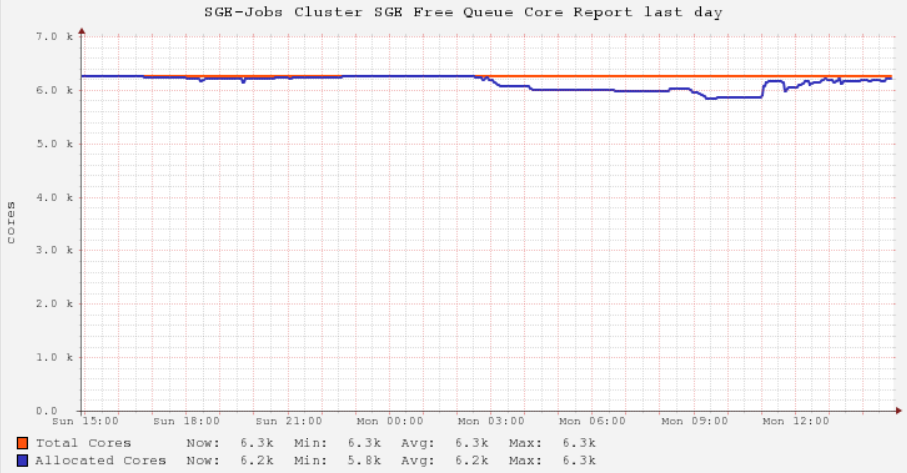 .
.
The graph above is a proxy for how well cluster use can be optimized if the scheduler is allowed to submit jobs to the optimal Q.
The above graphs will be important in deciding how to structure HPC3
4. How Jobs are currently scheduled
HPC is a partial Condo cluster. The university paid for the central core of the cluster, including most of the storage, the core service machines, networking, power, cooling, personnel, and other basic infrastructure. Individual Schools, Departments, and individual PIs have added self-specified machines as their grants allowed. This has allowed the cluster to keep funded while still growing the computational capacity of the cluster.
Jobs are scheduled according to these rules:
-
Owners have top priority on their own servers and can run jobs on as many cores for as long as they want on self-owned servers. If other jobs are running (see below), those jobs will be suspended-in-RAM or killed if there are RAM conflicts.
-
By default, members of Research Groups will compete among themselves for scheduling jobs on the same-group-owned machines. So multiple jobs of same-group users can run simultaneously on the same machine in the same Q.
-
However, users in subordinate Qs will not be able to run jobs or qrsh to these nodes while even 1 core is being used by an owner-group user. This can lead to situations where a node is completely idle due to an owner qrsh’ed into it (doing nothing) since that qrsh job has 1 full core assigned to it.
-
Members of Schools can have priority access to to other resources from that School, depending on what resources have been purchased by the members of that School and the School itself. For example if Dr. Smith in Surgery (in the School of Medicine (SoM)) buys 2 servers, she can use those servers at the highest priority (the smith Q), ejecting competing Free Q users immediately. She also has equal priority to other to machines purchased by SoM the for their general pool (the som Q), and access at reduced priority on all the machines belonging to the other members of SoM (the asom (all-SoM) Q).
-
Finally, all resources not currently used are available to the Free Qs (segregated by hardware resources). Any user can submit jobs and compete at equal priority for these resources. Not surprisingly, these Free Qs are the most heavily and most efficiently used, since they are made available to all researchers at UCI regardless of whether they have paid for a condo node.
-
Overall, the subordinate Q priority is:
Personally Owned Qs → School Qs → All-School Qs → Free Qs -
Note that if a user explicitly names a Q on which to run, that will take precedence over available Qs. So if there are 1000 cores idle in a Free Q and the user specifies a non-Free Q for some reason, she will wait until the specified Q becomes free.
-
In addition, there are a number of pub Qs. These are Qs running on UCI-provided hardware and they are available for jobs on a first come basis. Jobs started on a pub Q will not be suspended; they will run to completion or timeout (currently 3 days).
4.1. Checkpointing
HPC currently uses the Berkeley Labs Checkpointing & Restart facility (BLCR) to allow very long runtimes on Qs that have a maximum runtime of 3 days. An unmodified program can request BLCR support in the scheduling request and the program will write a checkpoint image every 6 hours to disk, allowing the program to pick up again at that point, even surviving a full cluster shutdown. This remarkable technology allows almost infinite runtimes on time-limited Qs by re-submitting the checkpointed job at the end of the 3 day limit and re-starts where it left off when it is assigned a new job.
BLCR works with single-node machines, even with single-node MPI jobs, but does not support multi-node MPI jobs, so HPC has mostly supported only single node jobs. (This is in contrast to many jobs on the GreenPlanet Cluster where there are frequent multi-node MPI jobs.) Owners who buy multiple nodes can run multi-node MPI jobs to completion on those nodes, but non-owners are limited by the 3day runtime limit which BLCR cannot bypass.
However, Berkeley Labs lost funding for it and it will no longer be supported going forward, so a new technology or approach will have to be found to replace it.
5. Pro & Con for a Priority-based Scheduling system
These arguments are derived from the data presented above and below, but also depend strongly on whether UCI administration agrees to allow CPU and storage rental without applying overhead costs. Currently it is about 50% cheaper for PIs to buy a storage or compute server (as long as it costs more than $5K) than rent the equivalent resources from RCIC. This is the main driver of the inefficiency of the HPC cluster and if not changed, will cause HPC3 to suffer the same fate.
I’ve written previously about a priority-based Scheduling system based on the SGE ShareTree scheduler option. SLURM, the other major scheduler has a similar system called FairTree. I suggest that the Pay for Priority sytem would work better than the current Pay for Nodes system IF the question of overhead can be resolved.
5.1. Pro
-
It provides more resources that can be more flexibly allocated than the current model. Ganglia shows that the HPC cluster is losing about 40% of its computational cycles due to bad user choices and the impossibility to overcome those choices.
-
With more resources to manage jobs, it becomes possible to much more efficently pack the cluster to make use of all the otherwise idle cores. See above.
-
Showing optimal efficiency will enable RCIC and faculty to argue for more funding. It’s hard to argue for more funds when the efficency is so low.
-
by having the scheduler decide the optimal placement of jobs based on user resource (CPUs, RAM, runtime) estimation, job packing eficiency should increase significantly.
-
Most large clusters use variants of this approach to attain close to >90% CPU utilization.
-
the utilization of HPC’s own Free Qs shows how efficent this can be.
5.2. Con
-
congestion and edge cases will result in some users who have paid for priority on the cluster being slowed down in their ability to get jobs running. However, this will only be the case when the cluster is running at very high efficiency and RCIC will be in a position to use this optimal use scenario to argue for more resources.
-
there will be a requirement for users to size their jobs and request resources that optimally reflect their needs. Failure to do so will result in jobs that are prematurely terminated or longer wait times. This is the case now, so this doesn’t seem to be an increased problem. In both cases, education of how the system works should increase efficiency, but in the ShareTree model, more of it is automatic.
6. Current HPC hardware
The current HPC was initiated by a grant from SCE to increase power efficiency and about half the cores derive from that time. (That grant succeeded spectacularly, improving power efficiency by about 7-fold.) Since then, the condo model has encouraged another ~5000 cores of various types to be added and that heterogeneity is seen in the spectrum of CPUs shown below.
6.1. CPUs
The following table counts all the CPU cores on all the compute nodes and breaks them down into unique lines. Some are highly related, varying only in clock speed or minor model numbers, but I have not aggregated them.
Number   Processor (from '/proc/cpuinfo')
 =========================================================
  5449   AMD Opteron(tm) Processor 6376
  1197   AMD Opteron(TM) Processor 6274
   944   Intel(R) Xeon(R) CPU           E5450  @ 3.00GHz
   528   Intel(R) Xeon(R) CPU E5-2699 v4 @ 2.20GHz
   288   Intel(R) Xeon(R) CPU E5-2699 v3 @ 2.30GHz
   254   AMD EPYC 7551 32-Core Processor
   144   Intel(R) Xeon(R) CPU E5-2650 v4 @ 2.20GHz
   128   Intel(R) Xeon(R) CPU           X5570  @ 2.93GHz
   127   AMD EPYC 7601 32-Core Processor
    96   AMD Opteron(tm) Processor 6174
    87   AMD Opteron(tm) Processor 6376
    80   Intel(R) Xeon(R) CPU E5-4610 v4 @ 1.80GHz
    72   Intel(R) Xeon(R) CPU E5-2697 v4 @ 2.30GHz
    72   Intel(R) Xeon(R) CPU E5-2695 v4 @ 2.10GHz
    64   Intel(R) Xeon(R) CPU E5-2630 v3 @ 2.40GHz
    56   Intel(R) Xeon(R) Gold 6132 CPU @ 2.60GHz
    48   AMD Opteron(tm) Processor 6180 SE
    40   Intel(R) Xeon(R) CPU E5-2650 v3 @ 2.30GHz
    32   Intel(R) Xeon(R) CPU E5-4620 0 @ 2.20GHz
    32   Intel(R) Xeon(R) CPU E5-2650 0 @ 2.00GHz
    24   Intel(R) Xeon(R) CPU E5-4617 0 @ 2.90GHz
    24   Intel(R) Xeon(R) CPU           E5645  @ 2.40GHz
    19   AMD Opteron(TM) Processor 6274
    12   Intel(R) Xeon(R) CPU E5-2603 v3 @ 1.60GHz
    12   Intel(R) Xeon(R) CPU E5-1650 v2 @ 3.50GHz
     2   AMD EPYC 7551 32-Core Processor
     1   AMD EPYC 7601 32-Core Processor
6.2. RAM
Most of the machines have been purchased by Bio/Med researchers doing Next-Gen / High Thruput Sequencing techniques and they usually bought the maximum amount of RAM with the machines
(from qhost output, close matched values pooled)
# nodes   with this much RAM
 ===========================
      1    1.5T
     74    504.9G
     45    252.4G
     18    126.1G
      8    94.6G
      3    63.1G
      1    47.3G
    118    31.5G
6.3. GPUs & hosts
The following are a list of Nvidia GPUs hosted on the named host in the HPC cluster.
Hostname      Model Name from 'lspci'
 =========================================================
compute-1-14: NVIDIA  GF110GL    [Tesla M2090] (rev a1)
              NVIDIA  GF110GL    [Tesla M2090] (rev a1)
              NVIDIA  GF110GL    [Tesla M2090] (rev a1)
              NVIDIA  GF110GL    [Tesla M2090] (rev a1)

compute-4-17: NVIDIA  GK110BGL   [Tesla K40m] (rev a1)

compute-4-18: NVIDIA  GK110B     [GeForce GTX TITAN Z] (rev a1)
              NVIDIA  GK110B     [GeForce GTX TITAN Z] (rev a1)
              NVIDIA  GK110B     [GeForce GTX TITAN Z] (rev a1)
              NVIDIA  GK110B     [GeForce GTX TITAN Z] (rev a1)

compute-5-4:  NVIDIA  GP104      [GeForce GTX 1080] (rev a1)
              NVIDIA  GP104      [GeForce GTX 1080] (rev a1)
              NVIDIA  GP104      [GeForce GTX 1080] (rev a1)

compute-5-5:  NVIDIA  GP104      [GeForce GTX 1080] (rev a1)
              NVIDIA  GP104      [GeForce GTX 1080] (rev a1)
              NVIDIA  GP104      [GeForce GTX 1080] (rev a1)

compute-5-6:  NVIDIA  GP104      [GeForce GTX 1080] (rev a1)
              NVIDIA  GP104      [GeForce GTX 1080] (rev a1)
              NVIDIA  GP104      [GeForce GTX 1080] (rev a1)

compute-5-7:  NVIDIA  GP104      [GeForce GTX 1080] (rev a1)
              NVIDIA  GP104      [GeForce GTX 1080] (rev a1)
              NVIDIA  GP104      [GeForce GTX 1080] (rev a1)

compute-5-8:  NVIDIA  GP104      [GeForce GTX 1080] (rev a1)
              NVIDIA  GP104      [GeForce GTX 1080] (rev a1)
              NVIDIA  GP104      [GeForce GTX 1080] (rev a1)

compute-6-1:  NVIDIA  GK110GL    [Tesla K20c] (rev a1)
              NVIDIA  GK110GL    [Tesla K20c] (rev a1)

compute-6-3:  NVIDIA  GK110BGL   [Tesla K40c] (rev a1)

compute-7-12: NVIDIA  GP104      [GeForce GTX 1080] (rev a1)
              NVIDIA  GP104      [GeForce GTX 1080] (rev a1)
              NVIDIA  GK210GL    [Tesla K80] (rev a1)
              NVIDIA  GK210GL    [Tesla K80] (rev a1)
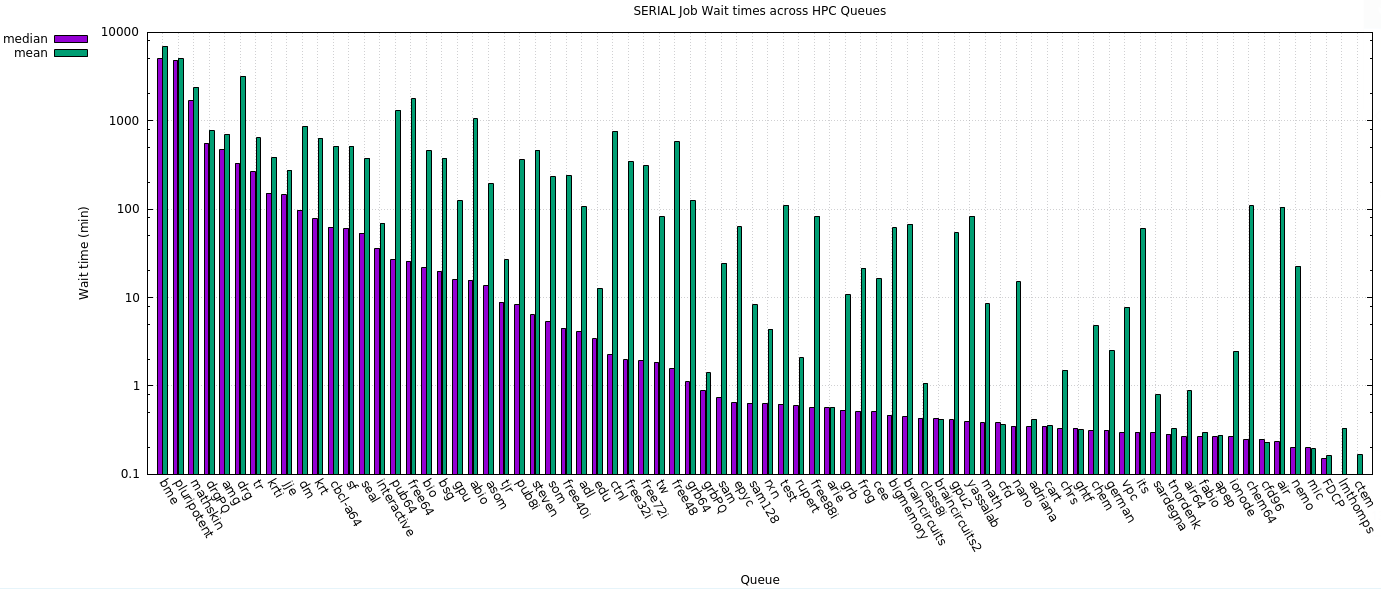
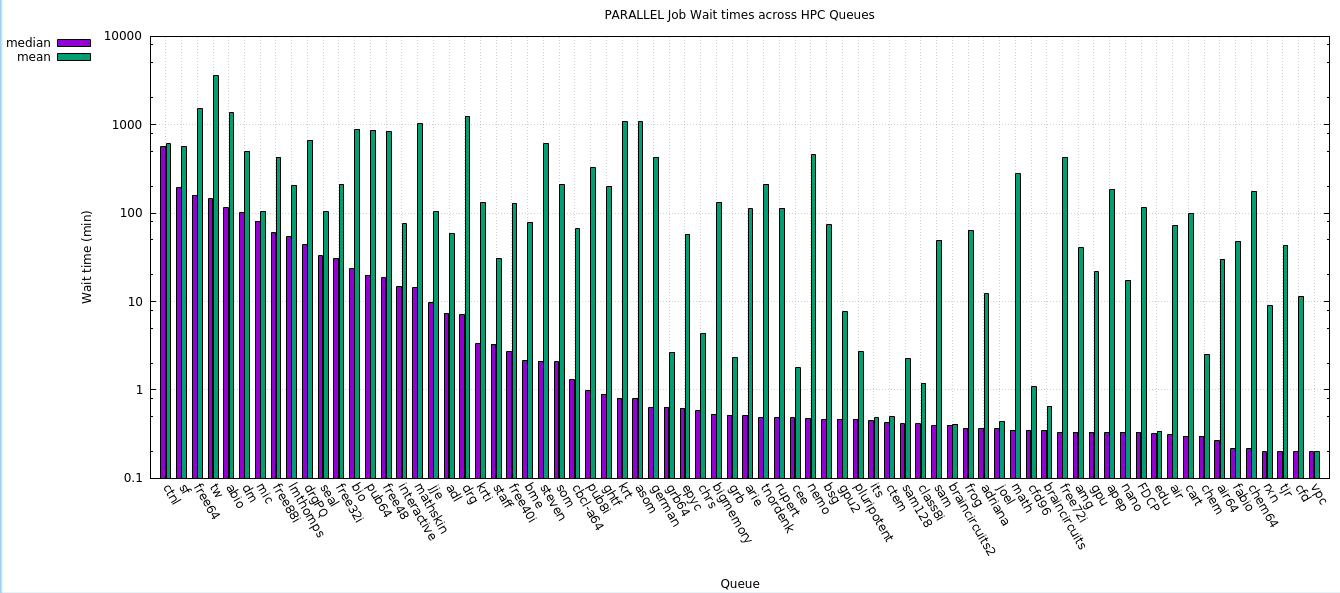
7. Wait times
Wait time is defined as the period in minutes between submission of the job to the time the jobs starts, an indication of how responsive the cluster is.
I’ve included both the median and mean wait times with the emphasis on median since the mean is heavily influenced by some extremely long wait times.
Note the wait times for various Qs are correlated of course to the types of jobs that the research groups run. ie. If the research group tends to run very long jobs, the wait times are similarly long, even if there are free cores available in the Free Qs. We see the overall effect of this even in the current availability to the BLCR checkpointing that would allow the jobs to run past the current limit of 3 days on the Free Qs.
It is notable that the wait times for parallel jobs are lower than for serial jobs over almost all the Qs. I would have expected the opposite. There are many fewer parallel jobs than serial jobs tho. See the tabular data that includes the number of jobs (not included in the plotted data).
In the data below, I have plotted the wait times by Q as well as providing since I think tabular data. I have sorted the wait times in descending values to allow better comparison tho.
7.1. Serial
7.1.1. Plots
7.1.2. Tabular data
In the table below, the public and free Qs are denoted with a *.
Median    Mean
Wait(m)   Wait(m)     # Jobs        Queue Name
 -------+--------+-------------+--------------
5017.12   6867.31  1.30496e+06             bme
4841.32    5031.4  2.08714e+06     pluripotent
1666.98   2384.05         7159        mathskin
557.533   776.796        42622           drgPQ
  477.5   697.914         2987             amg
328.533   3159.37        12200             drg
263.617   638.808       187229              tr
  150.2   385.966       211331            krti
144.833   275.443        31807             jje
   96.6   859.072        14862              dm
   77.5   628.258       948782             krt
62.3667   511.853        76637        cbcl-a64
   60.7   510.153       369477              sf
   53.1   373.181       120358            seal
  36.05   69.3454        12907     interactive   *
26.5667   1302.23  2.43851e+06           pub64   *
25.6333   1759.36  9.61396e+06          free64   *
   21.6   457.546  1.79057e+06             bio
19.8833   375.092        47083             bsg
16.1667   124.058        10226             gpu   *
15.6667   1045.18       959752            abio
13.6833   193.525       622369            asom
8.83333   26.8076        53606             tjr
8.33333   360.643  1.45109e+06           pub8i   *
6.36667   459.349        39673          steven
5.36667   232.621       482554             som
4.46667   241.817        68262         free40i   *
4.08333   106.608        28830             adl
3.43333   12.7069         8024             edu
2.26667   757.084        24849            ctnl
1.98333   348.476       535750         free32i   *
   1.95   309.195        55002         free72i   *
   1.85   81.6959        34487              tw
1.56667   578.012       487065          free48   *
1.11667   125.462       393443           grb64
0.88333   1.41131         2133           grbPQ
0.73333   24.5457       299180             sam
   0.65   62.9825         2050            epyc   *
0.633333   8.26738        39217          sam128
0.633333   4.35359       931712             rxn
0.616667   110.393        94873            test   *
    0.6   2.08089         1107          rupert
0.566667   82.9255       550843         free88i   *
0.566667  0.570565          124            arie
0.533333   10.6902        33228             grb
0.516667   21.4261        21153            frog
0.516667   16.3324       362894             cee
0.466667   61.1305         2248       bigmemory   *
   0.45   66.7552         2018   braincircuits
0.433333   1.08076          136         class8i
0.433333  0.417143           35  braincircuits2
0.416667   54.1427         2757            gpu2   *
    0.4   82.8138        24939        yassalab
0.383333   8.50822         3073            math
0.383333  0.363889           24             cfd
   0.35   15.0853       167686            nano
   0.35  0.422691           83         adriana
   0.35   0.36069          198            cart
0.333333    1.5124          445            chrs
0.333333   0.32193           19            ghtf
0.316667    4.7688          930            chem
0.316667   2.53808          699          german
    0.3   7.73441         7085             vpc
    0.3   59.9687          332             its
    0.3  0.798007         2559        sardegna
0.283333  0.329268           82        tnordenk
0.266667  0.885714          210           air64
0.266667   0.30106          393           fabio
0.266667  0.275214          156            apep
0.26666   2.48513         6222          ionode
   0.25   108.612         3869          chem64
   0.25  0.232456           19           cfd96
0.233333   103.939          314             air
    0.2   22.6159           64            nemo
    0.2  0.195833           12             mic
   0.15  0.163305         2836            FDCP
      0  0.333333            1        lmthomps
      0  0.166667            1            ctem
7.2. Parallel
7.2.1. Plots
7.2.2. Tabular data
In the table below, the public and free Qs are denoted with a *.
Median    Mean
Wait(m)   Wait(m)     # Jobs        Queue Name
 -------+--------+-------------+--------------
566.533   606.157          286            ctnl
195.433   558.397        10131              sf
157.717    1501.3  1.50923e+06          free64   *
144.442   3595.17        23820              tw
115.133   1352.86       274499            abio
100.417   499.822         2102              dm
  80.35   104.673          607             mic
59.7333    427.54        78132         free88i   *
53.8083   207.134          402        lmthomps
   43.7   664.383         4656           drgPQ
32.9333   105.328        30950            seal
30.9167   210.408       101657         free32i   *
23.8833   885.743       208458             bio
19.7167   868.379       329228           pub64   *
18.6167   836.831       106886          free48   *
   14.9   75.6493         1581     interactive   *
14.5333   1016.57          850        mathskin
    9.7   104.994        62446             jje
7.41667   59.3733        25493             adl
7.08333   1237.94         3339             drg
3.33333   131.317        92456            krti
3.26667   30.9547         2179           staff   *
2.75833   128.252        24568         free40i   *
   2.15   78.0836         1645             bme
    2.1   612.213         1938          steven
2.08333    213.03        24252             som
    1.3   66.5254         4748        cbcl-a64
0.983333   324.053       593881           pub8i   *
    0.9   199.932          539            ghtf
    0.8   1088.76        48705             krt
    0.8   1081.16        15073            asom
0.633333   425.481          825          german
0.633333   2.67077           61           grb64
0.616667   57.1815         2428            epyc   *
0.583333   4.37337          920            chrs
0.533333   133.006          825       bigmemory   *
0.516667   2.35455           55             grb
0.516667   111.676           91            arie
0.483333   210.074          730        tnordenk
0.483333   112.673        26066          rupert
0.483333   1.77312       130189             cee
  0.475   454.494         1898            nemo
0.466667   73.8276         7242             bsg
0.466667   7.68072          255            gpu2   *
0.466667   2.74276         1293     pluripotent
   0.45  0.483784           37             its
0.433333  0.499745          327            ctem
0.416667    2.2836         1966          sam128
0.416667   1.18655         2376         class8i
    0.4   49.2699        32087             sam
    0.4  0.412424           55  braincircuits2
0.366667   64.1131         3182            frog
0.366667   12.2316         1283         adriana
0.366667  0.442069          145            joel
   0.35   276.524         5230            math
   0.35   1.08711          190           cfd96
   0.35  0.652507          113   braincircuits
0.333333   429.284         8171         free72i   *
0.333333    40.357         3175             amg
0.333333   21.6384        13317             gpu
0.333333    186.35          423            apep
0.333333   17.3112          514            nano
0.333333   116.247          582            FDCP
  0.325  0.340625           48             edu
0.316667   73.1669          774             air
    0.3   98.6406         1300            cart
    0.3   2.52425          712            chem
0.266667   30.1297         2297           air64
0.216667   48.2366         1304           fabio
0.216667   177.211         1160          chem64
    0.2   8.91091        20437             rxn
    0.2   43.3334        65010             tjr
    0.2   11.3852          728             cfd
    0.2       0.2            7             vpc
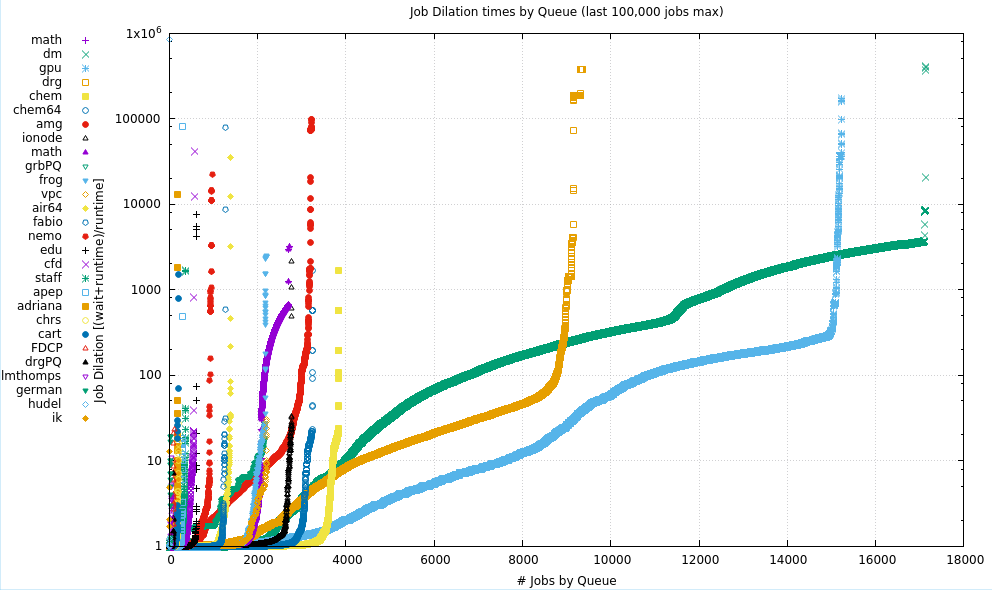
8. Job Dilation Ratios
Dilation is the amount of wall clock time to which the job runtime expands when also counting the wait time. Large Dilation Ratios are seen when there is a long wait time for much shorter job runtimes. In a perfect world, this number would near 1 (zero wait time for whatever the job runtime).
In the 2 plots below, the dilation ratio:
(wait time + run time)
----------------------
       run time
is plotted for most of the Qs. The data for each plot has been sorted for value to allow patterns to be see more easily. The X axis is simply the number of jobs (having non-zero runtimes) that have been extracted from each Q.
The number of Qs is divided roughly in half, showing large Qs in the upper plot, and smaller Qs in the lower plot.

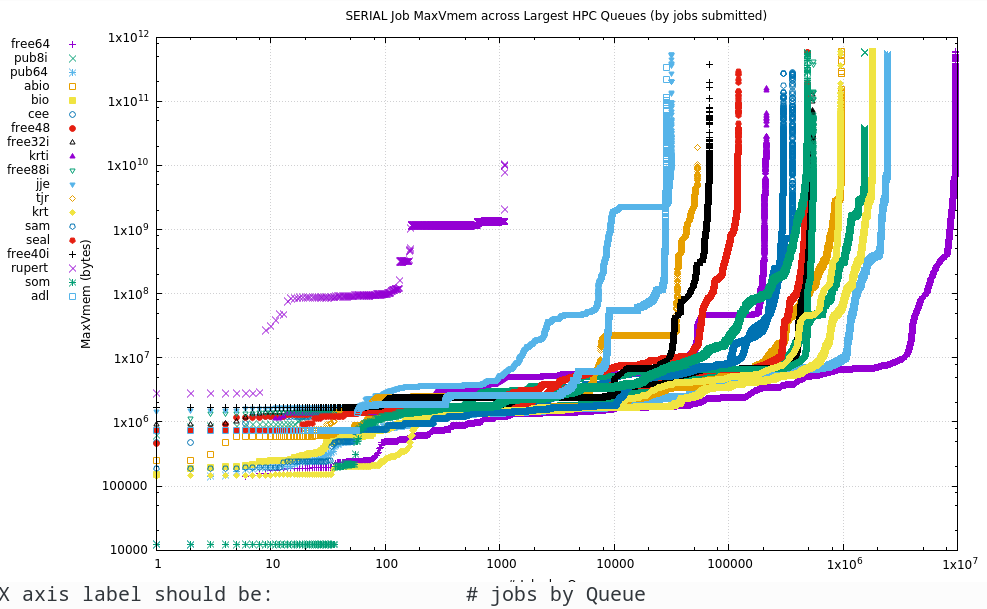
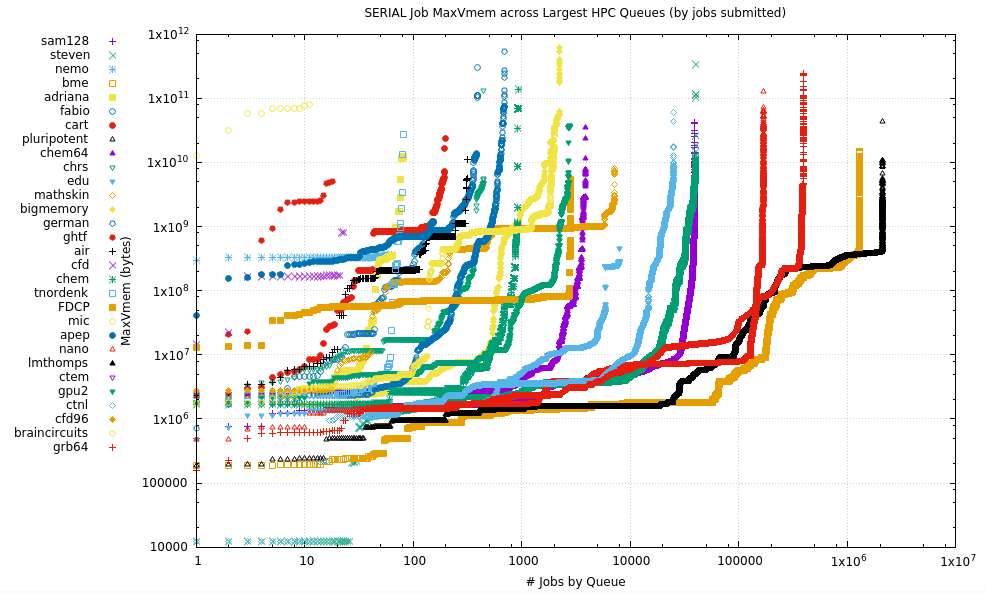
9. Maximum RAM Usage
This is the maximum usage of programs in the different Qs. The plots below show the maximum RAM usage sorted over that # of jobs that have been run in each Q, so each line will run from the smallest RAM used (typically due to an early failure) to the largest RAM used. In the
Due to the extreme values in each axis they are plotted on a log-log scale.
9.1. Serial
The Serial plots are simply the maximum RAM used by the process. In the Parallel section below, the RAM is the aggregated usage over multiple MPI processes or OpenMP or other threads.
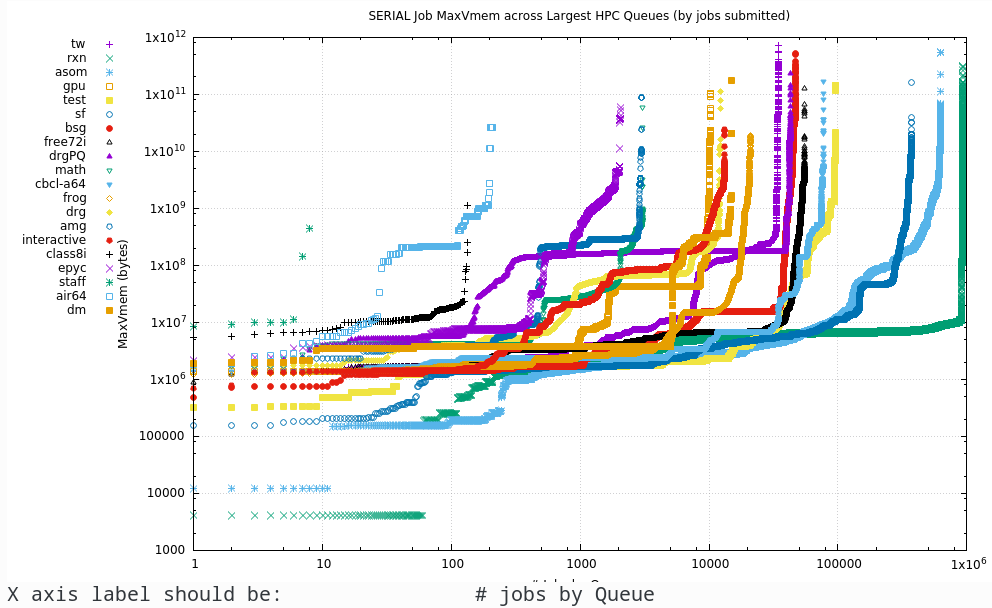
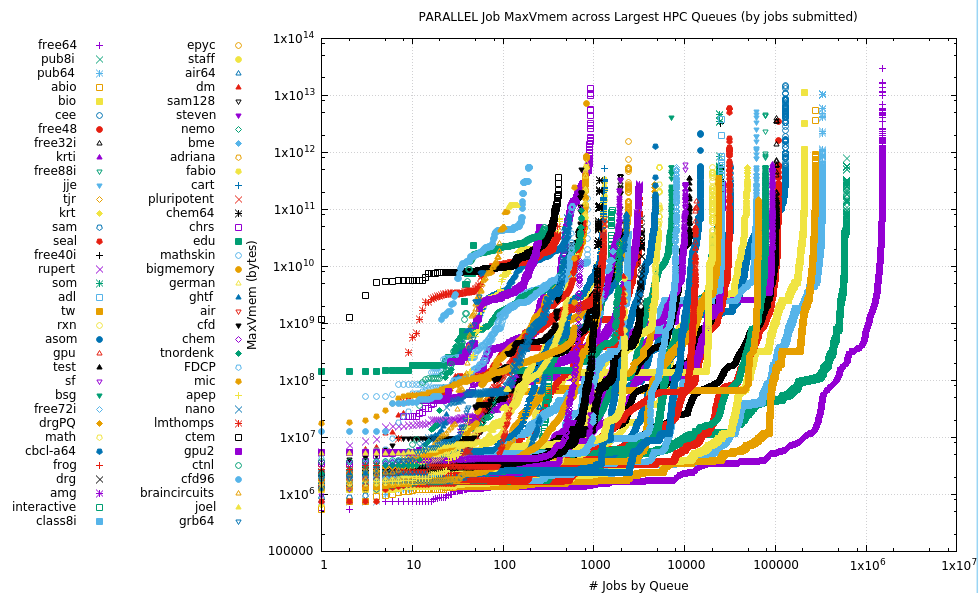
9.2. Parallel
In the Parallel plots below, the RAM is the aggregated usage over multiple MPI processes or OpenMP or other threads.
9.3. 5M Maxvmem usage
The following figure shows the maximum vmem rcorded over the last 5M jobs (serial and parallel, all Qs).
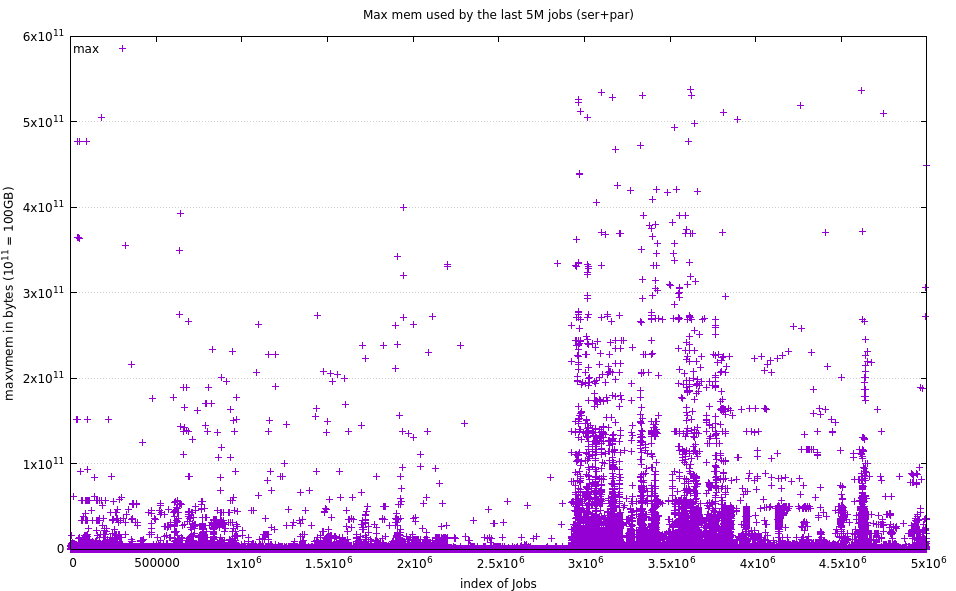
As a crude measure, from this data set, the Mean was 469MB, while the Median was 256MB (that’s MB, not GB).
Of the 5M data points:
    702 (0.014 %) exceeded 128GB
  1,447 (0.028 %) exceeded  64GB
147,165 (2.943 %) exceeded   1GB
==
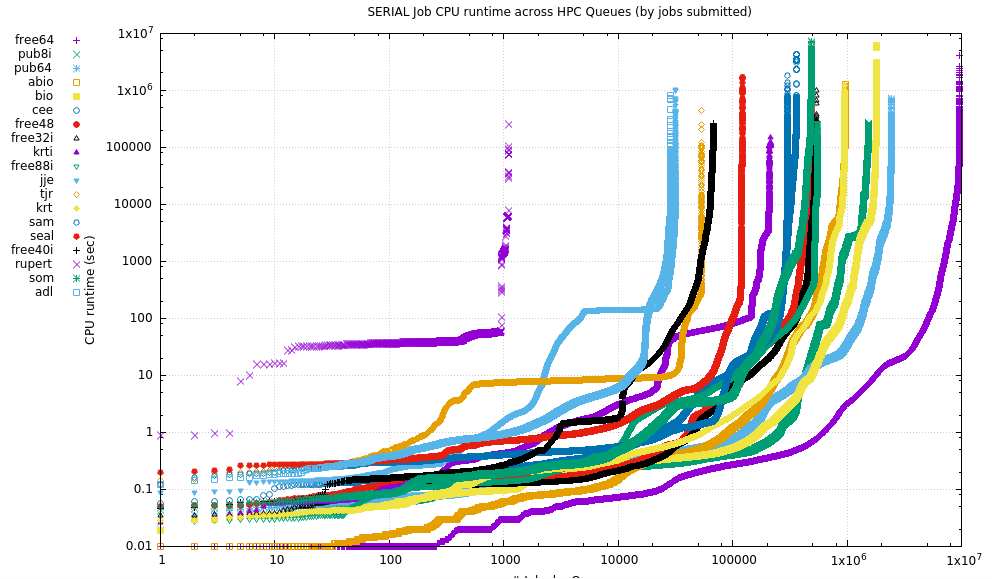
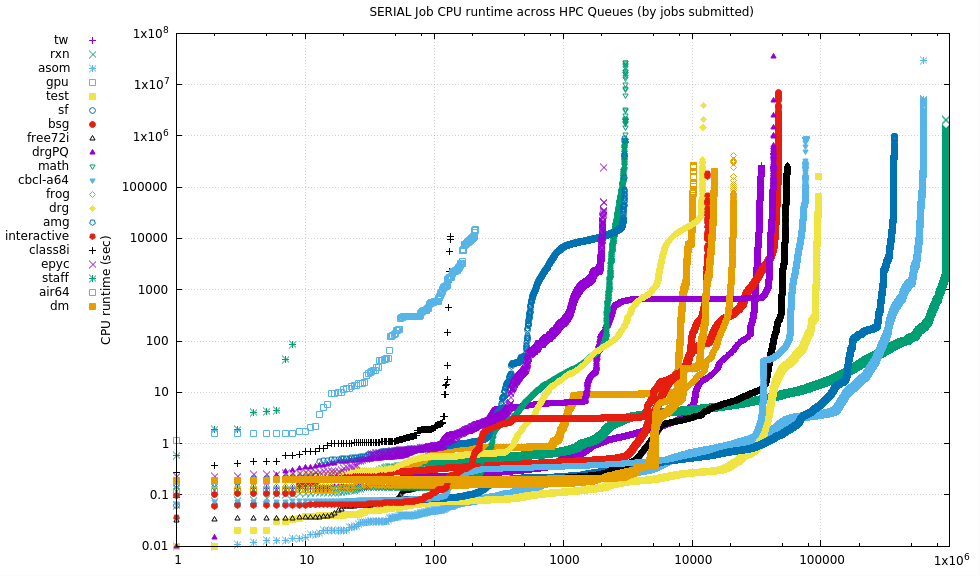
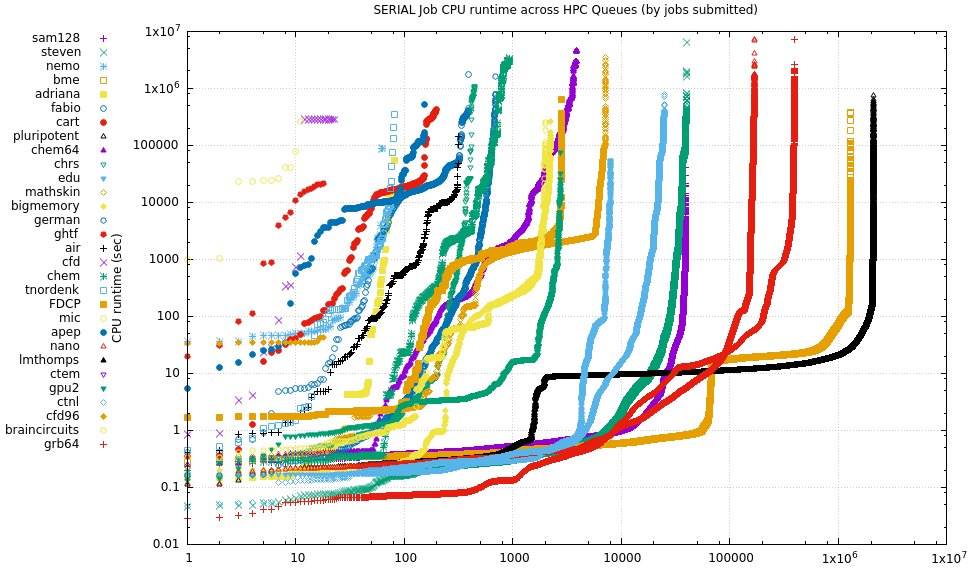
10. CPU Usage
10.1. Serial
In the Serial CPU usage, the CPU time denoted is directly related to the process submitted. ie: the time it takes for one process to complete.
10.1.1. Plots
These plots are roughly segregated by into Qs with large numbers of jobs, a medium # of jobs and a fairly small number of jobs, but those jobs can vary considerably by value.
10.1.2. Tabular data
Median   Mean
runtime  Runtime          #            Queue
(s)      (s)             Jobs           Name
-------+------------+-------------+----------
140637   142089           24              cfd
28594.3   303461         3869          chem64
23806.4  45151.9           12             mic
21956.3  70183.9          393           fabio
18299.3    72552          198            cart
10654.2  41295.3          156            apep
10497.3  9078.01           19            ghtf
8939.78  9211.75         2987             amg
8601.8   417138          930            chem
6008.61  23889.2        12200             drg
2719.26  6264.67          316             air
2152.54  13969.4         7159        mathskin
1972.92  4130.51         2836            FDCP
1135.63  1824.28          124            arie
905.765  3568.24           35  braincircuits2
655.59  3929.01        42622           drgPQ
644.03  11483.9           82        tnordenk
591.164  2532.09          210           air64
448.076  11264.7        47083             bsg
257.163  28214.5          699          german
251.375  4356.37         2248       bigmemory   *
239.177  1295.63         2050            epyc   *
227.962  2337.25         2018   braincircuits
188.706  3168.74           64            nemo
183.57    14788       482555             som
179.964  5760.11   1.5331e+06           pub8i   *
147.569  30971.6          332             its
144.528  1090.42        31807             jje
116.139  4929.35       369477              sf
108.349  5488.15       959755            abio
107.666     4305       948782             krt
103.028  5048.65  1.79058e+06             bio
102.432     7218       622371            asom
100.466  844.105       931712             rxn
91.175  5310.24        68263         free40i   *
86.9333  866.002        33228             grb
83.5703  1147.69       211331            krti
 83.35  9275.64       362897             cee
79.037  6658.65       393446           grb64
  75.6  4234.36    9.614e+06          free64   *
  65.1  2579.67  2.43852e+06           pub64   *
56.577  972.073       550843         free88i   *
50.409  1340.21         1107          rupert
48.562  6019.76       487073          free48   *
 45.39  3952.25       535762         free32i   *
43.0974  5810.72        76638        cbcl-a64
42.999  3839.15        34487              tw
40.686   113630         3073            math
 35.66  11385.5        24849            ctnl
34.642  35.0584           19           cfd96
26.936  140.475  1.30496e+06             bme
24.393  434.891       299180             sam
21.822  74.8996  2.08714e+06     pluripotent
 21.35  383.859        94873            test   *
19.3675  58032.6          448            chrs
18.626  6513.17       167687            nano
17.555  214.913        13171     interactive   *
17.268  756.779        21153            frog
17.253  481.957         2761            gpu2   *
 12.33  829.671        28830             adl
12.124   9085.9        39673          steven
9.63503  141.849        53606             tjr
9.37157  2210.23        10279             gpu   *
 9.086  4744.21        55002         free72i   *
 8.439  661.772       120358            seal
6.19506  1764.31        14869              dm
 4.337  2545.02           83         adriana
 2.866  54.0468        39217          sam128
1.3945  302.937          136         class8i
0.8315  707.544         8024             edu
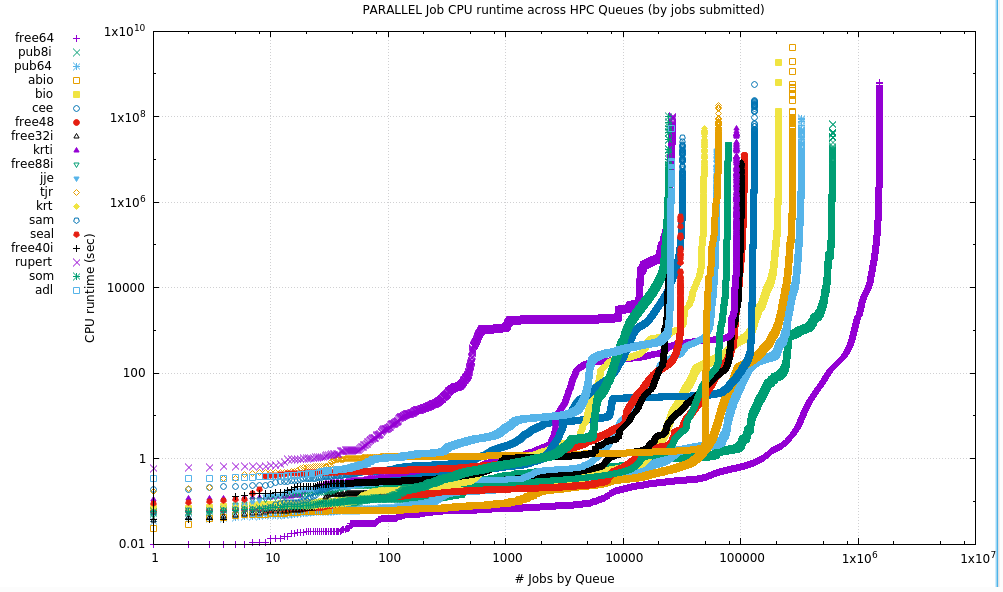
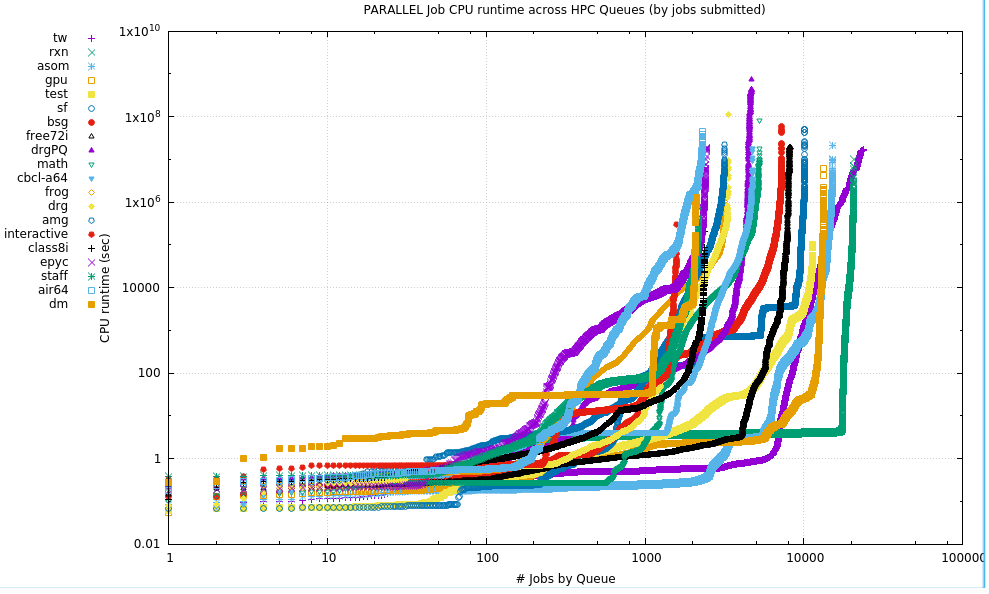
10.2. Parallel
For Parallel jobs, the runtime is the aggregate of all the MPI processes or OpenMP or other threads. There is no segregation of jobs by the number of cores requested here, just that the number was greater than 1.
NB: Due to the extreme values collected, this is a log-log plot. Due to the number of Qs, the data have been divided into 3 plots
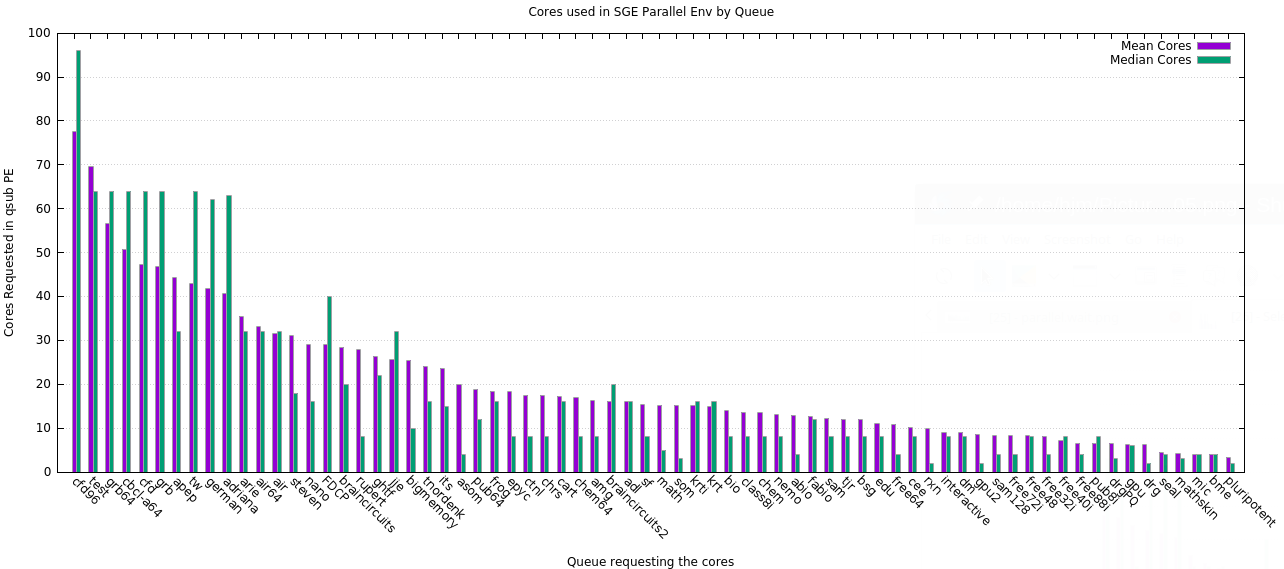
10.2.1. Plots
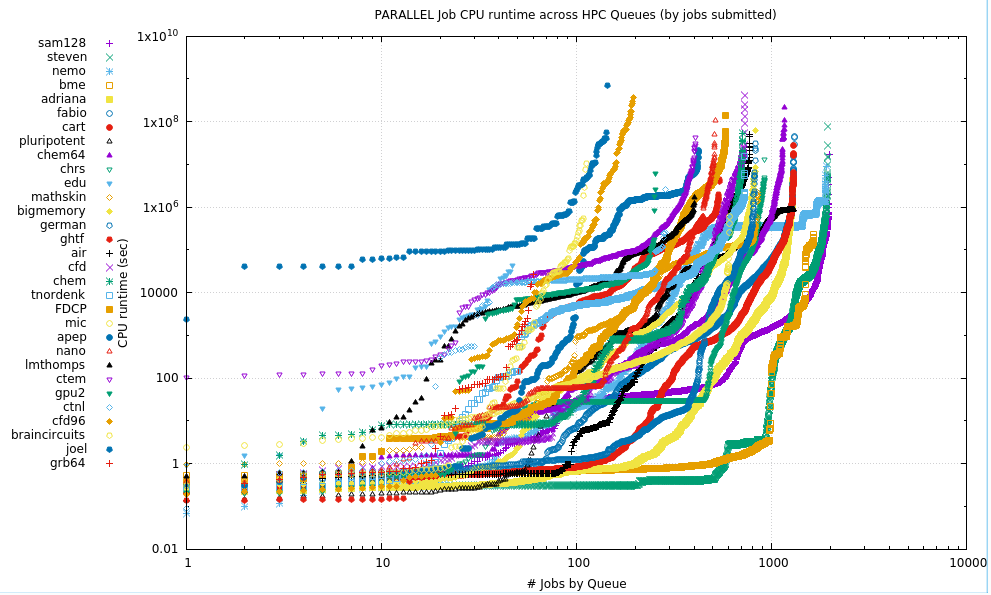
The following plot shows the number of cores requested (by Mean & Median) when slot requests were greater than one. It makes no assumptions about the distribution of requests between Serial & Parallel.
10.2.2. Tabular data
Median         Mean
runtime        Runtime           #            Queue
(s)            (s)              Jobs           Name
 ----------+---------------+----------+---------------
1.51662e+06  1.81311e+06         423            apep
1.43667e+06  2.35095e+06          91            arie
    345485       426096         1898            nemo
    115392       268089         1293     pluripotent
    101270       204212          539            ghtf
   68331.5       100119          850        mathskin
   67472.8  2.44662e+06          582            FDCP
   43050.5  1.79089e+07          196           cfd96
   24706.5       230068          730        tnordenk
   22779.8      40893.8          286            ctnl
   22580.4       852107         2299           air64
   13276.4      66292.7          255            gpu2   *
   12696.7  1.91118e+06        23821              tw
   12216.2       330273          825       bigmemory   *
   11936.3      33602.2           55  braincircuits2
   10442.2  1.61827e+06         1160          chem64
   9584.07  1.09018e+06          774             air
   7328.27      30341.9         3182            frog
   7144.13       165937         2428            epyc   *
   7122.53  1.10464e+06          514            nano
    6755.6       601425          712            chem
   6511.51       266025         1304           fabio
   5480.19       177852         5231            math
   4038.51       745960        26066          rupert
   3335.05  2.84016e+06          728             cfd
   1854.02      64323.5        24252             som
    1798.9       173631         1300            cart
   1657.24       6608.2           48             edu
   1605.99       219295         3175             amg
   1593.84      44488.7        32087             sam
   1477.01      42073.9         1966          sam128
   1342.45       246239          113   braincircuits
   1098.17      84222.9         3339             drg
   1082.19       130210         7242             bsg
   866.954      24688.8       599129           pub8i   *
   793.008      61143.3        48705             krt
   751.679       103677        10131              sf
   627.747      67514.2       208459             bio
   562.107      25635.9        92456            krti
    500.13      52876.7           55             grb
    485.01       4303.4          607             mic
   435.672      43912.6         1283         adriana
    422.82      10183.6        25493             adl
   350.027       100697         4748        cbcl-a64
   310.693   5.7686e+06         4656           drgPQ
   287.942      14884.9        62446             jje
     271.2      68342.9           37             its
   250.953       180832  1.50924e+06          free64   *
    249.09      66272.3       274499            abio
   217.722       101697       329231           pub64   *
     170.3      40421.1        15073            asom
    118.58      1838.23        11370            test
    74.069       199704          825          german
    70.301      1266.32           61           grb64
   52.9225      219.216        30950            seal
    52.114      28706.5       101658         free32i   *
    43.883      36327.3       106887          free48   *
   34.4098      12995.3         2103              dm
   34.2755      85047.6       130194             cee
    33.759       169321          920            chrs
   23.6775      784.842         2380         class8i
   17.4445       139662         1938          steven
    15.792      1129.99         1581     interactive   *
   12.4335       126419        78132         free88i   *
   11.0395      11574.3        24568         free40i   *
     6.105      11003.1        13317             gpu
   4.00439        10604        20437             rxn
     3.903       204784         8171         free72i   *
     2.224      12268.8         1645             bme
     1.553       318193        65014             tjr
11. CPU Time:Maxvmem Heatmap
The following plot shows the results of binning successful runtimes (exit value = 0) and their maxvmems. The bins are shown on the axes. The values plotted are the log(# of jobs) to allow a better sense of spread. This binning does show some stratification, most notably that almost all of our jobs max at about 128GB. Tho invisible, there are a few that exceed 128G - see the numeric data below. Also, low mem jobs enormously dominate, at all runtimes, and vast majority of them are less than 2hrs. We could buy considerably more cores if we reduced the amount of RAM on each node and allocate some nodes for very long runtimes.
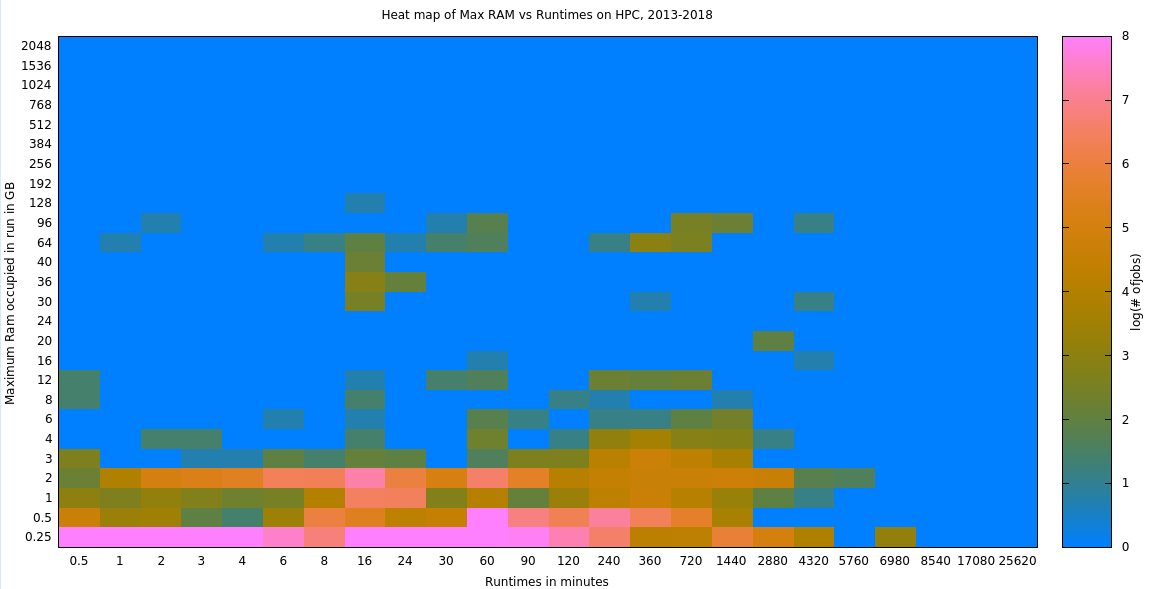
The log-transformed data for this heatmap is here.
The original count data for this heatmap is here.
12. Integrated RAM use
Integrated RAM use is the integral of the RAM use of a program over the course of its entire lifetime (in GB-s). It gives an indication of how RAM is used THROUGH the program’s run. However, this information is only really useful if we can map particular programs RAM profiles together to most efficiently pack compatible ones together on the same node and we aren’t collecting this information.
(Incomplete)
You can view crude plots of individual Integrated RAM use by Q here
I will look into providing a similar set of integrated plots (as above) soon.